
Project Overview
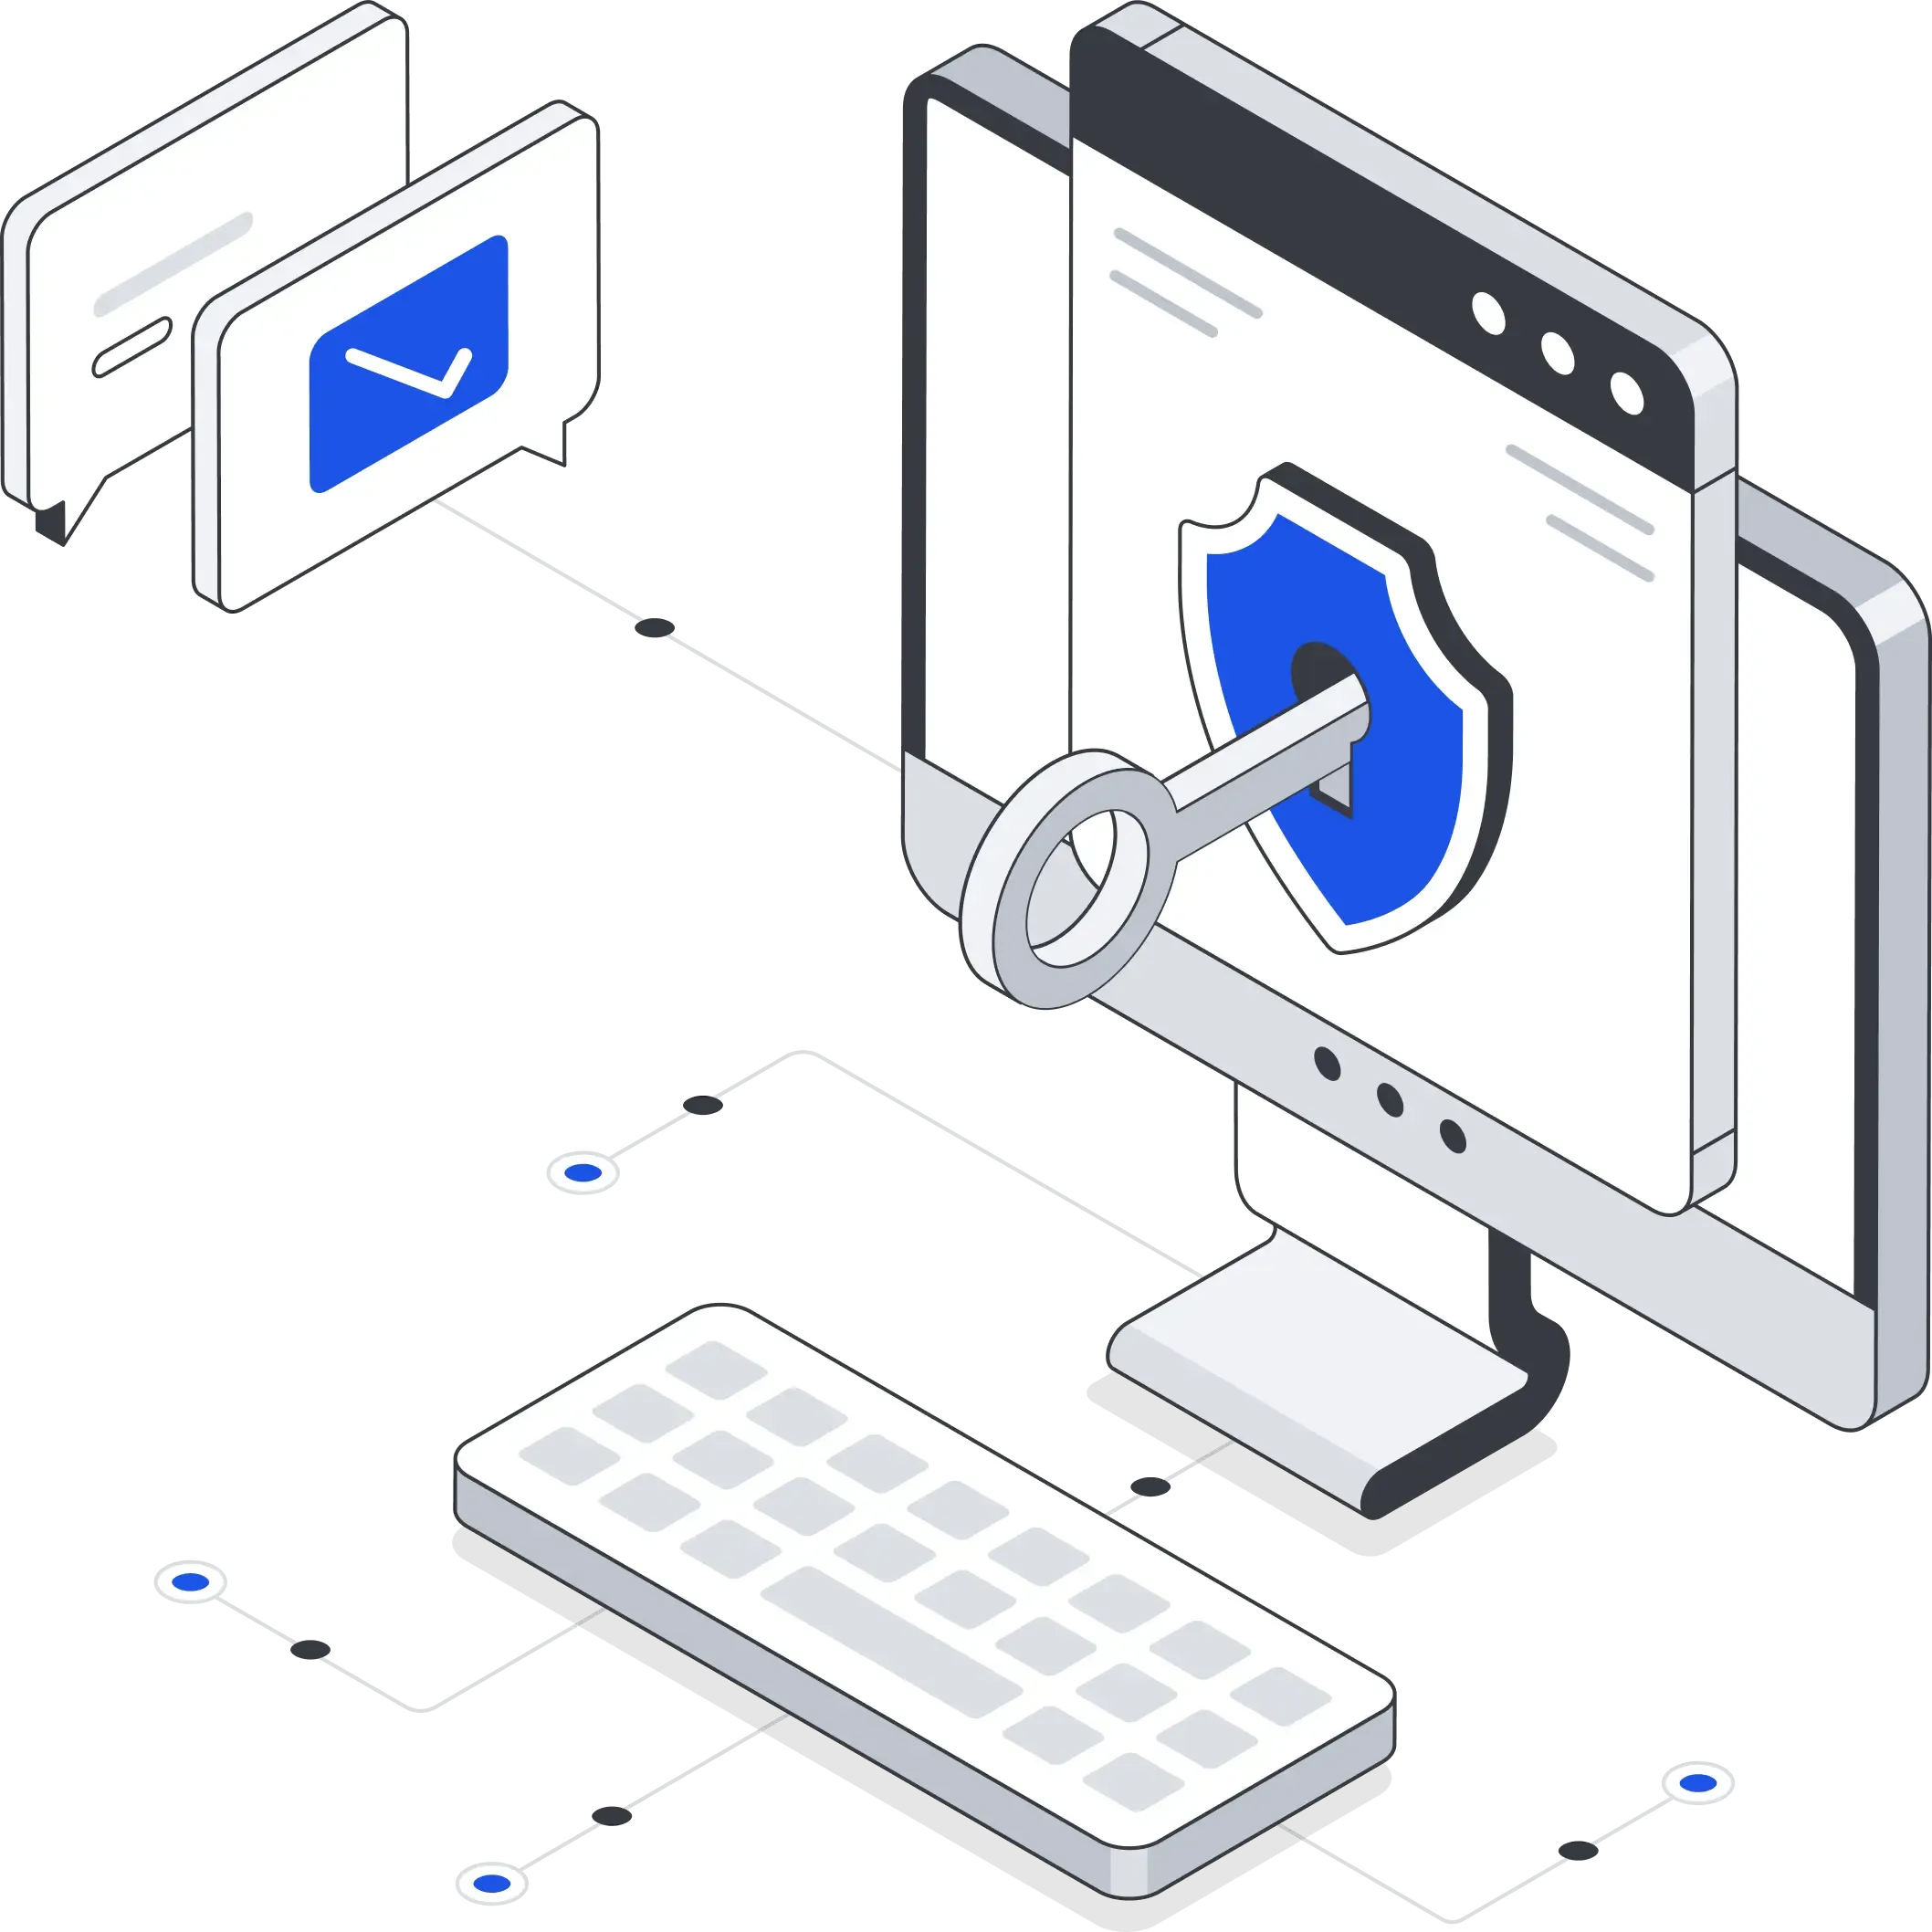
The DigNow project encompassed a multifaceted set of challenges, starting with the need to envision and develop three separate but interconnected modules: the Task Board, Analytics Dashboard, and Whitepaper Dashboard, with varying functionality but an identical overarching and user-friendly user interface. Providing dynamic real-time dashboards required performance optimization to keep up with massive amounts of off-chain and on-chain analytics in real time without a glitch while keeping them readable and graphically responsive. In order to provide a hassle-free experience to the high volume of users of the platform, focus was also required towards both front-end accessibility and back-end performance while providing advanced filtering, sorting, and searching capabilities for large datasets.
Designing and building the Task Board, Analytics Dashboard, and Whitepaper Dashboard with consistent UX while each had unique functionality.
Building interactive dashboards that can manage real-time updates and show a large volume of data without experiencing any performance problems.
Implementing efficient search, sorting, and filtering tools for big tables and charts.
In order to overcome these obstacles, Solicy, as a dashboard development company, created a unique frontend architecture that neatly divided data handling, logic, and layout. This allowed the Task Board, Analytics Dashboard, and Whitepaper Dashboard to retain their distinctive features while having a consistent user interface. The integration of WebSocket provided real-time synchronization of data, making it possible for dashboards to update in real-time without page refresh. Interactive UI components were introduced as well to make the application more usable and keep users engaged in the data on the platform. These included responsive hover effects, fluid animations, and simple quick-filter controls.
One-of-a-kind Frontend Architecture
Created a well-organized frontend architecture that divided data handling, logic, and layout, giving each module (Whitepaper Dashboard, Analytics Dashboard, and Task Board) distinct functionality.
Frontend WebSocket Integration
Real-time dashboard updates without page reloads are possible thanks to a connection to the backend's live data streams.
Complex User Interface Interactions
In order to improve the user experience, hover effects, quick-filter controls, and animations were used.

The Solicy team went above and beyond our expectations by creating a quick, easy-to-use, and aesthetically beautiful platform that seamlessly combined our Task Board, Analytics Dashboard, and Whitepaper Dashboard. Contribution, analysis, and insight discovery are now simpler than ever, thanks to real-time updating and the user-friendly navigation, which has completely changed how our community interacts with data.

A Breakdown of the Essential Features That Drove Measurable Results and Client Satisfaction
A dedicated community hub where members can view, claim, and complete data collection tasks, streamlining contribution workflows.
Combines off-chain and on-chain data with interactive tables, graphs, and charts to present real-time analytics of cryptocurrency projects.
Centralizes analysis results of project whitepapers, offering structured insights and summaries for quick reference.
Dashboards are refreshed dynamically through WebSocket integration so that manual refreshes are not required.
Enables precise and quick data discovery by providing multi-level filtering, sorting, and keyword search for large datasets.
Employs quick-filter controls, hover states, and fluid animations to guarantee interactive data exploration and navigation.
Delivers fast loading and responsiveness even when managing high-volume datasets for improved overall usability.
The DigNow platform was successfully re-designed as a seamless, data-focused environment so that it is simple for the members of the community to add, investigate, and find data on cryptocurrency projects. The solution made it possible for users to work with sophisticated data in an effortless way by combining real-time capability, performance optimization, and intuitive design.
For easy navigation and consistent user experience, Task Board, Analytics Dashboard, and Whitepaper Dashboard were consolidated into a single interface.
Via websocket-based real-time updates, users can view the updated analytics at once without page reload.
80% optimized data processing and rendering to ensure quick load times and avoid lag, even when working with high volumes of on-chain and off-chain data.
Developed a clutter-free design and simple navigation that is easy to use, making it easier for community members to engage with tasks and see detailed project information.
Added smooth animations, hover effects, and quick filters for more engaging and enjoyable data exploration.
The launch of the DigNow platform delivered an integrated 3-module interface with 100% real-time data updates, under 2-second average page loads, and boosted community task participation by 40% within the first month.
Previous Case study
Next Case study

AI Recruitment

Smart Parking Platform

HR Automation


